new
Alerts
See potential causes in monitoring

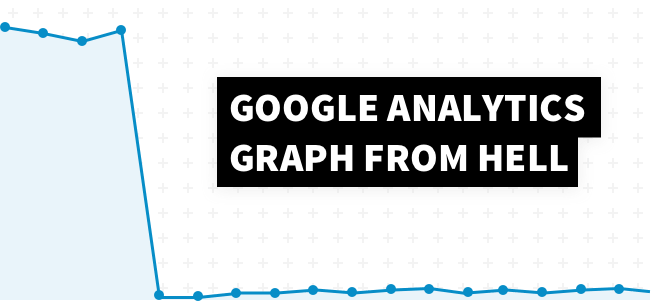
Ever witnessed the Google Analytics graph from hell in your account? All of a sudden your sessions, conversions or revenue went down the drain.
You don’t want to find out late something broke in your Google Analytics.
Introducing improved Google Analytics Monitoring
Make sure your Google Analytics is kept an eye on 24/7. We upgraded the monitoring algorithm and it will inform you immediately when there’s an abnormality in your data.
> Users on mobile not buying anymore? Instant alert.
> Sessions from Google / CPC dropping? Instant alert.
> Conversion rate down? Instant alert.
And the best part? You don't have to add custom alerts manually. All critical datapoints in your Google Analytics are monitored automatically.
How does it work?
- Activate- Add a site in your account and select the goals you want to monitor
- Set sensitivity- Decide how quickly alerts should be triggered
- Lean back, relax- If there’s an abnormality you get an instant e-mail alert
- Learn why- When an alert fires our algorithm looks for potential causes and let you know
Changes made:
- Potential causes and scoring
- Cleaner design
New: segments causing a change
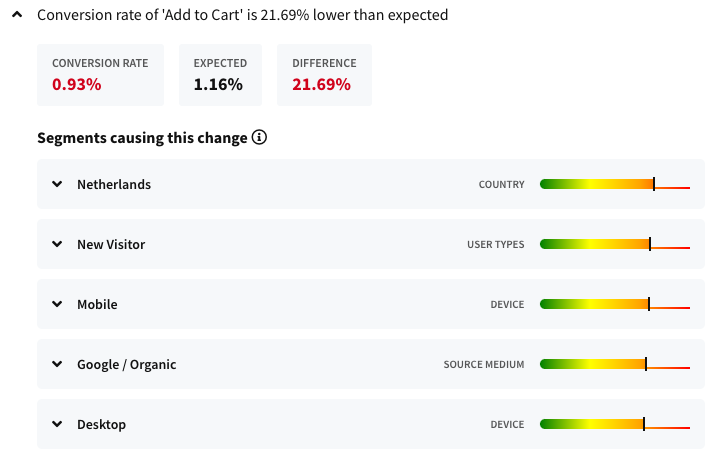
When an issue occurs, you want to know why it's happening. For example, when your conversion rate went down by 40% you want to know: why did it happen? With this update, this is possible! We calculate and show the segments causing the change.
We calculate a score for each segment, and use this to sort from high to low.

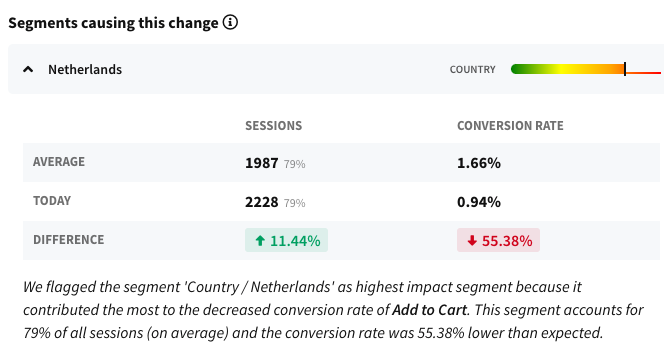
You can also extend each segment, to get a better understanding:

Got any questions? Feel free to contact us!